

Quick Answer:
Instagram Insights is a free analytics tool available for Instagram Professional (Creator and Business) accounts. It helps you understand your audience, measure content performance, and make smarter posting decisions to grow faster.
Growing on Instagram can feel like guessing in the dark. You post a photo or video, wait a few hours, and hope people like it. To grow steadily, you need real data.
Here is what you should know right away:
- It works for both Creator and Business accounts. Some basic tools like scheduling are open to all public accounts, but full Insights still require a Professional profile.
- No follower minimum is required.
- The 2026 dashboard includes updated Reels metrics like skip rates and retention graphs.
What Is Instagram Insights?
Instagram Insights is a built-in analytics tool that tracks how people interact with your profile and posts. It shows numbers for views, interactions (including likes, comments, saves, and shares), profile visits, and link clicks. Note that “Impressions” are no longer shown in the mobile app.
Instagram created this feature so creators and businesses can make smart content decisions. The Instagram algorithm rewards posts that keep people watching and sharing. Insights shows you which posts hit those goals so you can post more of them.
Why Analytics Matter for Growth
General account numbers only show top-level stats like total likes. Insights go much deeper. They show whether non-followers saw your post, where your audience lives, and which posts generate traffic.
Accounts that use Insights to guide their strategy grow much faster than accounts guessing their topics.
+-------------------------------------------------------------------+
|                  WHAT'S NEW IN INSIGHTS (2026)                    |
+-------------------------------------------------------------------+
| * Reels Skip Rate: See the % of users swiping away in 3 seconds.  |
| * Content Recommendations: Direct tips from Instagram algorithms. |
| * Detailed Retention: Visual line graphs for video drop-offs.     |
+-------------------------------------------------------------------+
Who Can Use Instagram Insights?
Anyone with an Instagram Professional account can access Insights. Personal accounts do not get access to full analytics features.
Professional vs Personal Accounts
Instagram offers three main account types:
| Account Type | Access to Insights? | Primary Use Case |
| Personal | No | Private sharing with friends and family |
| Creator | Yes | Influencers, public figures, and content creators |
| Business | Yes | Brands, local stores, and online sellers |
Do You Need a Certain Number of Followers?
No, you do not need a minimum number of followers. You can switch to a Professional account on day one with zero followers and start tracking data right away.
Why Some Demographics Don’t Appear
Sometimes your age, gender, or location graphs will say “Not Available.” According to Meta Help Center guidelines, Instagram hides demographic details on small audiences to protect user privacy. Once your content reaches enough unique accounts, these stats appear automatically.
How to Access Instagram Insights
Accessing your data is fast on both mobile devices and desktop computers.
On iPhone and Android
- Open the Instagram app.
- Tap your profile picture in the bottom right corner.
- Tap Professional Dashboard under your bio.
- Tap Insights to view your overall menu.
On Desktop
You can also view your data on a computer using two methods:
- Web Dashboard: Log into Instagram.com, go to your profile, and click Professional Dashboard.
- Meta Business Suite: Go to business.facebook.com. Select your connected page and click Insights on the left menu.
Switching to a Professional Account
If you currently have a Personal profile, you can switch for free in under a minute:
- 1.Open Settings:30 seconds.
- Tap the three lines in the top right corner of your profile and select Settings and privacy.
- 2.Select Professional Tools:15 seconds.
- Scroll to For professionals and tap Account type and tools.
- 3.Choose Profile Type:15 seconds.
- Tap Switch to professional account. Select Creator or Business to finish.
Understanding the Instagram Insights Dashboard
The dashboard serves as your navigation home screen. It helps you find where specific data lives before you analyze individual numbers.
+-------------------------------------------------------------------+
|                    PROFESSIONAL DASHBOARD                         |
+-------------------------------------------------------------------+
|  [Overview]  Last 30 Days v                                       |
|                                                                   |
|  Accounts Reached ..................................... 14,200    |
|  Accounts Engaged .....................................  1,850    |
|  Total Followers ......................................  3,100    |
|                                                                   |
|  [Content You Shared]                                             |
|  Reels  |  Carousels  |  Stories  |  Posts                        |
+-------------------------------------------------------------------+
The home screen is divided into five main navigation areas:
- Overview: Sets your target date range, such as 7, 30, or 90 days.
- Accounts Reached Screen: Leads to details about total reach, non-follower reach, and profile visits.
- Accounts Engaged Screen: Leads to total interactions like likes, comments, saves, and shares.
- Total Followers Screen: Leads to growth charts, top locations, age ranges, and active hours.
- Content You Shared: Lets you filter and sort past posts by specific metrics.
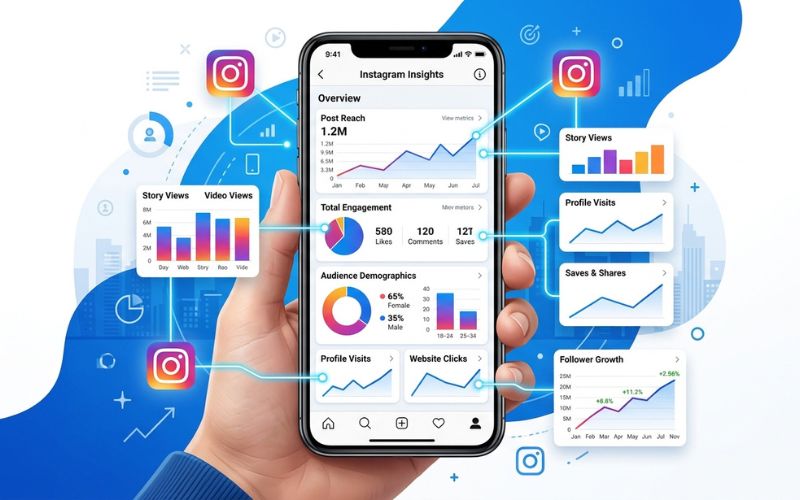
Instagram Metrics Explained (What Every Number Means)
Understanding your numbers is essential for building a better posting plan. Here is a clear guide to what each term means:
| Metric | Meaning | Why It Matters | Good For |
| Reach | Unique accounts that saw your post | Shows overall visibility | Reaching new people |
| Views | Total plays and views (replaces Impressions) | Shows repeat views | Measuring stickiness |
| Accounts Engaged | Unique accounts that interacted with you | Proves your content interests people | Building active fans |
| Content Interactions | Total likes, comments, saves, and shares | Measures complete audience action | Testing content quality |
| Profile Visits | People who tapped your username | Shows interest in your brand | Getting new followers |
| Website Clicks | Taps on your external bio link | Measures traffic leaving Instagram | Tracking sales & sign-ups |
Reach vs. Views
Reach counts unique people. If one user watches your Reel four times, your reach is 1. Views count total plays and displays (replacing the old “Impressions” metric in the mobile app). In that same example, your views total is 4.
Illustrative Performance Benchmarks
How do you know if your numbers are good? Use this simple table as an estimated guide for average account goals:
| Metric | Average Account Goal | High-Performing Account Goal |
| Engagement Rate | 1% to 3% | 5%+ |
| Reels Skip Rate (First 3 sec) | 40% to 50% | Under 30% |
| Average Watch Time | 15% to 25% of length | 40%+ of length |
| Non-Follower Reach | 20% to 30% | 60%+ |
How to Calculate Engagement Rate
To find your true engagement rate on a post, use this simple formula:
$$\text{Engagement Rate} = \left( \frac{\text{Total Interactions}}{\text{Reach}} \right) \times 100$$
Example: If a post reaches 1,000 people and gets 50 total interactions (likes + comments + saves + shares), your engagement rate is 5%.
Reels Metrics (2026 Updates)
Video is critical for growth on Instagram. The updated 2026 dashboard includes these specific Reels numbers:
- Watch Time: Total combined time viewers spent watching your Reel.
- Average Watch Time: Average seconds each person stayed on your video.
- Retention Graph: A visual chart showing exact seconds where people swiped away.
- Skip Rate: Percentage of users who swiped away in the first three seconds.
- Share Rate: Percentage of viewers who sent your Reel to someone else.
How to Read Instagram Insights Like a Growth Strategy
Looking at raw numbers is step one. Taking smart action on those numbers is what actually grows your account.
Use this simple feedback guide to turn stats into strategy:
- If Reach is low: Focus on stronger video hooks or post when your followers are online.
- If Shares are high: Note the topic immediately. High shares mean users found it relatable. Make more posts on that exact topic.
- If Saves are high: You made valuable educational content. Create similar step-by-step guides or tip lists.
- If Skip Rate is high on Reels: Your opening scene was slow. Add text on screen or action in the first three seconds.
- If Watch Time drops fast: Your video ran too long. Trim middle pauses and make future videos shorter.
- If Profile Visits spike but Followers stay flat: Visitors liked your post, but your bio was unclear. Rewrite your bio to state clearly who you help.
- If Website Clicks are low: Your call to action was weak. Remind viewers in your video to click the link in your bio.
Real-World Mini Case Study
The Scenario: A fitness creator posted two Reels.
- Reel A (Workout Clip): Got 10,000 views, 500 likes, 5 shares, and 2 new followers.
- Reel B (Form Mistake Guide): Got 3,000 views, 80 likes, 320 saves, 110 shares, and 45 new followers.
The Strategy Lesson: Reel A looked successful because of high views. But Reel B brought in much more followers! High saves and shares prove that useful form tips turn viewers into followers much better than workout clips.
How to Use Instagram Insights to Grow Faster
Now that you know how to read your stats, use these practical steps to speed up your growth.
1. Find Your Best Time to Post
Tap Total Followers and scroll to Most Active Times. Look at the peak hours for each day. Schedule or publish your content 30 to 60 minutes before your audience activity hits its peak.
2. Identify Your Best Content Format
Open Content You Shared and filter by reach over the last 30 days. See which style won:
- Reels bring in non-followers and build brand awareness.
- Carousels earn high saves and build trust.
- Stories deepen relationships with existing followers.
Double down on the format that matches your current goal.
3. Track Conversions with GA4 and UTM Links
If you sell products or build an email list, connect Instagram to Google Analytics 4 (GA4). Put custom link tags (UTM parameters) on your bio link.
When someone taps your bio link and buys a product, GA4 tracks that sale back to your Instagram account. This proves whether your bio traffic turns into revenue.
Monthly Instagram Insights Audit Checklist
Checking stats every day can waste time. Instead, run a 15-minute audit at the end of every month.
Use this simple checklist to track your monthly progress:
- [ ] Review Top Posts: Record your top three posts by reach, saves, and shares.
- [ ] Review Bottom Posts: Find your three lowest posts. Note what failed so you can avoid it.
- [ ] Track Follower Balance: Check if net growth was positive.
- [ ] Verify Active Hours: See if follower online times changed over the month.
- [ ] Check External Clicks: Count how many bio link taps occurred.
- [ ] Plan Next Month: Write down five new post ideas based on your winning content.
Instagram Insights vs Meta Business Suite vs Third-Party Analytics
As your brand expands, you might need more advanced tools. Here is how built-in Insights compares to desktop tools:
| Feature | Instagram Insights | Meta Business Suite | Third-Party Tools |
| Cost | Free | Free | Paid ($15 to $200+/mo) |
| Platform Access | Mobile app | Desktop web | Desktop & Mobile |
| Data History | Up to 90 days | Up to 2 years | Unlimited |
| Data Exporting | No | Yes (CSV & PDF) | Yes (Custom PDF) |
| Best For | Solo creators | Dual FB/IG managers | Agencies & Teams |
Exporting Reports from Meta Business Suite
If you need to save reports for clients or team meetings:
- Log into Meta Business Suite on desktop.
- Click Insights in the left menu.
- Select your date range in the top right.
- Click Export Data to download a CSV or PDF file.
Common Instagram Insights Problems and Fixes
Here is how to fix technical issues with your analytics:
Insights Not Showing
Ensure you are using a Creator or Business account. Personal accounts cannot see full Insights. If you are already on a Professional account, update the app or log out and back in.
Demographics Not Appearing
Instagram hides age, gender, and location stats on small audiences to meet privacy standards. Keep posting consistently to increase your reach past the privacy limit.
Historical Data Limited to 90 Days
The mobile app only retains 90 days of stats. To keep track of yearly growth, write down your totals monthly or use Meta Business Suite on desktop for two-year records.
Delayed Data Reporting
Analytics numbers sometimes shift a day after posting. Data may take up to 48 hours to finalize as Instagram processes interactions in real time. This minor delay ensures your final totals remain accurate.
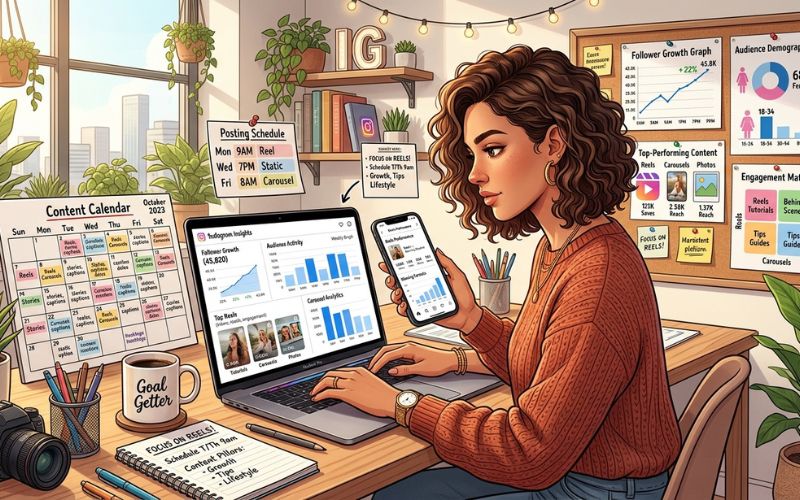
Common Mistakes People Make When Reading Instagram Insights
Avoid these frequent mistakes when reading your data:
- Chasing Likes Only: Likes are easy to give, but they do not grow accounts. Focus on saves and shares.
- Ignoring Non-Follower Reach: If your non-follower reach is under 20%, your account will struggle to grow.
- Comparing Unrelated Formats: Do not compare a quick Story photo to an educational Carousel. Compare similar formats against each other.
- Never Testing Posting Times: Audience habits change over time. Re-check your follower active times every few months.
Conclusion
Instagram Insights removes the guessing game from growing your account. By making data-based decisions, you stop wasting time on posts that fail.
Take action today with these three simple steps:
- Open your Professional Dashboard right now.
- Filter your content by Shares over the last 30 days.
- Plan your next post around the topic that earned the most shares!
Frequently Asked Questions
What are Instagram Insights?
Instagram Insights is a free built-in analytics tool for Professional accounts. It tracks reach, views, engagement, and follower demographics.
Is Instagram Insights free?
Yes, Instagram Insights is 100% free for all Creator and Business accounts.
Can personal accounts use Instagram Insights?
No, personal accounts cannot access full Insights. You must switch to a free Creator or Business account.
Can I see who viewed my profile?
No, Instagram does not reveal individual usernames of profile visitors due to user privacy rules. You can only view total visit counts.
What is the difference between reach and views?
Reach counts the number of unique accounts that saw your post. Views count the total number of times your post was played or displayed on screen (replacing Impressions).
How long does Instagram keep Insights data?
The Instagram mobile app keeps data for 90 days. Meta Business Suite on desktop stores records for up to two years.
Can I export Instagram Insights data?
You cannot export data from the mobile app. You can export CSV and PDF reports using Meta Business Suite on desktop.
Which metric matters most for account growth?
Shares and non-follower reach are the two most important growth metrics. They put your content directly in front of new audiences.
You May Also Like:
Instagram Story Ideas for Businesses and Creators
Instagram Verification Requirements Explained
Disclaimer:
This article is for informational and educational purposes only. We do our best to keep the information accurate, but features may change over time. Some images may be AI-generated for illustration only. All trademarks, logos, brand names, and copyrights belong to their respective owners.

Eleanor Karen is an administrator at PVStory.co.uk who writes about digital tools, social media trends, and online resources. She shares helpful insights on Instagram Story Viewer tools and other web-based solutions, helping readers stay informed and make the most of their online experience.